PlatformUse CasesPricing PlansResourcesCompany
LoginGet my demo

Platform

Coffee image

Platform overview

Learn more about Quantum Metric.

Data

Session replayUnderstand the "why" behind customer behaviors. Segment builderSlice your audience with nested segment building. AutocaptureCapture over 300 metrics out-of-the-box.Page performanceDiscover and quantify the impact of slow pages. User analyticsUnlock better user adoption, retention, and customer journeys.Platform intelligenceOur powerful machine learning engine.Mobile app analyticsPatented mobile analytics technology.Adobe Experience Platform Connector Go live with CJA faster.

Insights

Felix AI AgenticAutonomous agents analyze every part of the customer journey.Felix AI SummarizationGen AI powered session summarization.JourneysUnderstand which paths customers are taking.Interaction heatmapsVisualize page-level clicks, scrolls, and attention.VisibleVisualize user behavior directly from your browser. DashboardsOrganize and monitor your most important data. Opportunity analysisAutomatically surface and quantify friction points.

Action

Voice of CustomerConnect feedback to behavior and take action in real time.Monitoring & alertsAlerting on aggregate behavior, frustration, and more.Data activationSeamlessly merge any data source.Data streamingSend Quantum Metric insights to your data warehouse.Data enrichmentGet greater impact with enhanced data insights.Salesforce Lightning analyticsGain visibility and understanding of Salesforce Lightning app users.Performance & overheadLightweight SDKs and tags.Security & privacyBest in class security technology and polices.

See for yourself.

Schedule a personalized discussion and walkthrough of our solution.

Talk to our team.

Schedule a personalized discussion and walkthrough of our solution.

Join a regularly streamed demo of our top features and use cases.

Watch a live demo.

Join a regularly streamed demo of our top features and use cases.

Review platform use cases and capabilities at your own pace.

Browse product tours.

Review platform use cases and capabilities at your own pace.

Use Cases

Industries

RetailUnderstand shoppers’ needs faster.Financial servicesDrive digital adoption and improve satisfaction.Travel & hospitalityGrow revenue and loyalty with real-time visibility.TelcoImprove the digital-first experience.GamingUnderstand real-time player behavior.HealthcareImprove patient self-service and loyalty.

Teams

ProductUnderstand any part of the digital experience in seconds.TechnologySurface and scope customer technical friction in real-time.MarketingStrengthen your campaigns and convert more.AnalyticsAnswer the “why” behind the customer experience.CX & VoCBring together qualitative and quantitative insights.UXDeep insight into behavior, engagement, and friction.Service & supportImprove customer empathy and contact center efficiency.

Solutions

Digital analyticsMonitor, diagnose, and optimize critical experiences.Product analyticsUnderstand user behavior and drive adoption.Experience analyticsSurface pain points and quantify opportunities.Journey analyticsInsights into every touchpoint across the digital journey.Web analyticsUnderstand and report on digital performance.Employee experienceAutomatically surface critical friction on your internal apps and kiosks.Contact centerOptimize contact center experiences.AI DetectionReveal how AI agents interact with your digital experience.

See for yourself.

Schedule a personalized discussion and walkthrough of our solution.

Talk to our team.

Schedule a personalized discussion and walkthrough of our solution.

Join a regularly streamed demo of our top features and use cases.

Watch a live demo.

Join a regularly streamed demo of our top features and use cases.

Review platform use cases and capabilities at your own pace.

Browse product tours.

Review platform use cases and capabilities at your own pace.

Resources

Learn

ResourcesReview expert guidance and new data. Case studiesDiscover our customer stories.Product tour libraryReview platform use cases and capabilities at your own pace. Events & webinarsJoin us for live or virtual events. BenchmarksReview the top findings from Quantum Metric aggregated platform data.BlogThought leadership, trends, and product insights.Digital Analytics FAQGet quick answers to foundational digital and product analytics questions.

Community

The QuadConnect with experts, converse, and be inspired.

New blog post.

AI assistants vs. agentic AI: Key differences in digital analytics.

AI assistants vs. agentic AI: Key differences in digital analytics.

Learn how understanding the distinction between AI assistants and agentic AI becomes essential for everyone working in digital experience, analytics, or strategy.

Read the blog

Company

About us

Our storyHow Quantum Metric started, our leadership team, and how you can get involved.CareersSee what it's like to work for Quantum Metric, and available positions.NewsRead the latest announcements and news.

Partner network

Partners & integrationsView our technology and solutions partners.Partner programOur key ecosystem of partners.

Latest news.

Quantum Metric Reports Record 2025 Enterprise Expansion and Agentic AI Momentum for 2026

Quantum Metric Reports Record 2025 Enterprise Expansion and Agentic AI Momentum for 2026

Learn more

Blog/

2023 Retail Snapshot: Mapping mobile habits.

2023 Retail Snapshot: Mapping mobile habits.
6 min read

2023 Retail Snapshot: Mapping mobile habits.

Elissa Quinby

Elissa Quinby

Apr 11, 2023

Add as a preferred source on Google
2023 Retail Snapshot: Mapping mobile habits.

Summary:

  • Mobile now accounts for about three quarters of digital traffic and more than 60% of retail sales, while desktop still holds just under 30% of traffic despite year-over-year declines.
  • Shoppers are increasingly comfortable purchasing on mobile, with mobile conversion rates up 13% and native apps, especially Android, significantly outperforming mobile web.
  • Average order values on mobile rose from $121 to $125 between Q4 2022 and Q1 2023 and are up 23% year over year, even amid economic uncertainty.
  • Brands using Quantum Metric for mobile analytics have reduced frustration and abandonment while increasing order values, showing that better mobile experiences directly support revenue growth.
  • Retailers should prioritize mobile analytics to optimize first-screen experiences, create parity with desktop, and simplify purchasing, building loyal, high-value mobile customers.

By now, it’s almost trite to say we are a mobile-first world. Reports from Insider Intelligence predict that mobile commerce will grow another 15% in 2023 alone. But, what does that mean for the mobile experience? And where should retailers be prioritizing investments in mobile optimization?

To uncover the answers to these questions and others, we went to Quantum Metric’s own data to examine anonymized aggregated insights on digital behaviors over the last two years. What we found is that mobile adoption is not only trending upward, it’s creating a huge opportunity to drive new revenue and customer loyalty—if the experience is right.

Looking at device adoption from both sides.

Mobile usage is higher than ever before. In Q1 2023 alone, mobile makes up an average of 74% of monthly traffic to digital properties. Well above the majority, Q1 2023 traffic levels are also 9% what they were in Q1, 2022.

Monthly traffic shares by device: Oct. 2022 – March, 2023
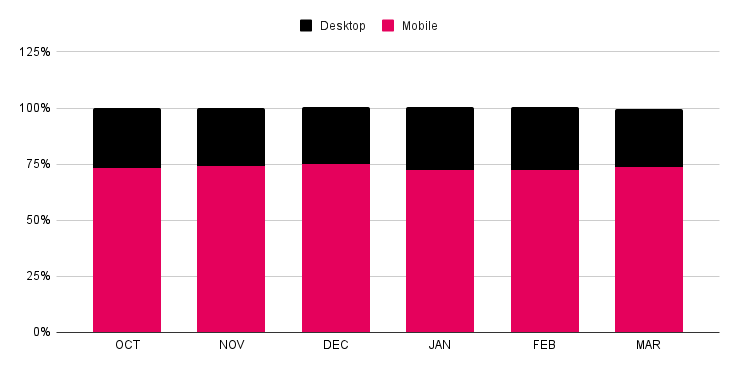
All that said, it’s not necessarily over for desktop. In fact, desktop continues to make up just under 30% of digital traffic, despite seeing a 17% YoY decline in traffic between Q1, 2022 and Q1, 2023. This shows that while the majority of consumers are making the move to mobile-first, there are still customers that are not ready to switch over. Convenience is not enough, it will take a heightened experience that feels comparable to desktop to get them to make the switch.

Mobile is making the move from research to purchase.

Alongside traffic, mobile is also driving retail revenue in 2023. Quantum Metric’s data shows that mobile is not just for research any more and in fact, customers may be even more comfortable making purchases on mobile versus desktop. In the first quarter of 2023, mobile made up 62% of monthly sales.

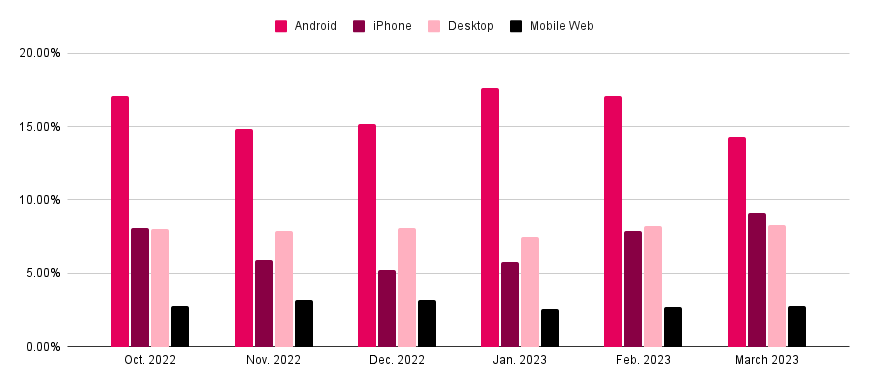
When it comes to conversion rates, or the percentage of visitors to a retailer site that made a purchase, mobile saw a 13% increase in monthly conversions between December, 2022 and March, 2023. So, between native apps and mobile web, who sees higher conversions? Native apps. In fact, apps earned an average monthly conversion rate over the last six months that was four times higher than mobile web. Breaking things down even further Android-specific native apps see the highest conversion rate, with a 129% lead on average over Apple.

Monthly conversion rates by device type: 2022-2023
As conversions climbed in early 2023, so did average order value (also known as the average cost of consumer’s purchases). Between Q4, 2022 and Q1, 2023, average order values grew from a monthly rate of $121 to $125. Not to mention, when you look year-over-year average order values for Q1 have grown 23% between 2022 and 2023. This is all despite economic instability, higher living costs and tighter consumer budgets.

Q1 monthly average order values for mobile: 2022-2023
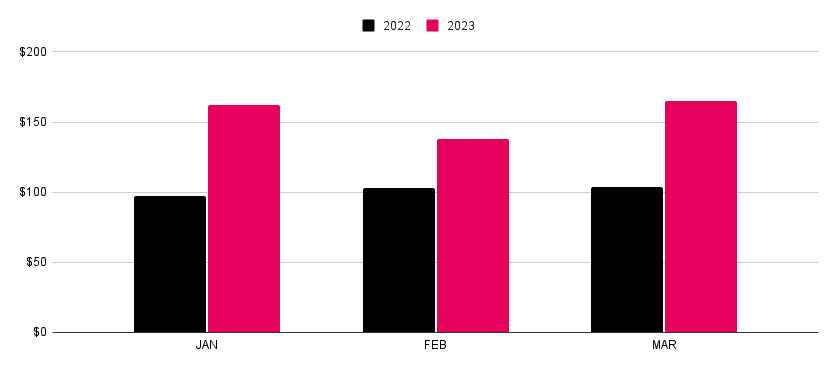
The takeaway? The mobile experience is becoming a major driver for purchases and it’s not just small, one-off items. Consumers are using mobile to research and make higher value or bigger cart purchases. In response, retailers need to focus their mobile optimization efforts on continuing to build purchasing confidence and maximizing value.

With the right investments and tools, mobile will drive revenue in 2023.

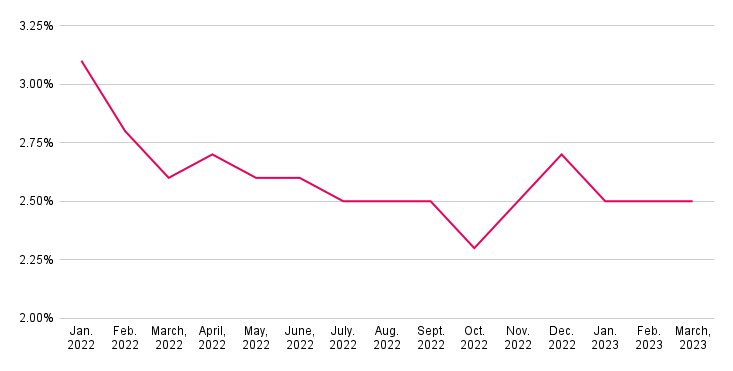
The key to keeping confidence and order values up? Keeping frustration and abandonment down. Quantum Metric data showed that brands who use our platform for mobile analytics, have seen a 12% drop in average monthly frustration rates and a 2% drop in average monthly site abandonment rates between Q1 2022 and Q1 2023. All while their average order values increased by 23%.

Monthly mobile frustration rates: 2022 – 2023
To drive revenue and efficiency in their mobile experience in 2023, retailers need to prioritize investments in mobile analytics that provide insight and context into the unique journey customers are having on mobile. This will enable teams to uncover how to prioritize initiatives such as:

  • The mobile first-screen experience – diving into if and how your customers are scrolling on mobile web or app and minimizing frustrations that can cause them to leave before they are engaged.
  • Building parity between mobile and desktop – examining how resizing images, product or text placement can create a completely different experience and drive adoption.
  • Simplifying the purchasing experience – understanding how one-click, minimal step purchasing options can ease the purchasing experience, drive upsells and boost return purchases.

Most importantly, investments in mobile analytics build happy customers. Happy mobile customers are more loyal to a brand, opting to not just purchase one item, but building their cart with the number of things they might need. They have the potential to become a mobile customer for life.

For more insight on consumer behaviors from the holidays and beyond, check out our latest retail benchmark report, The Holiday Wrap-up.

Want to know how Quantum Metric can help you reduce customer frustration and maximize revenue on mobile? Dive deeper into our mobile optimization capabilities with a demo.

Ready to kick things off?

Talk to sales icon to schedule a personalized demo based on your business objectives

Talk to our team.

Schedule a personalized discussion and walkthrough of our solution.

Watch Live Demo thumbnail

Watch a live demo.

Join a regularly streamed demo of our top features and use cases.

Browse Product Tours thumbnail

Browse product tours.

Review platform use cases and capabilities at your own pace.

LoginGet a demo

Platform

Platform overviewFelix AI AgenticFelix AI SummarizationJourneysMobile app analyticsInteraction heatmapsSecurity & privacy

Industries

RetailFinancial servicesTravel & hospitalityTelcoGamingHealthcare

Teams

ProductTechnologyMarketingAnalyticsCX & VoCUXService & support

Solutions

Digital analyticsProduct analyticsExperience analyticsJourney analyticsWeb analyticsEmployee experienceContact centerAI Detection

Resources

Contact usProduct tour libraryPricing plansResourcesCase studiesGlossary
Privacy PolicyTerm of UseEULAPatentsAffiliatesLegal InformationModern Slavery StatementDo Not Share My Information

© 2026 Quantum Metric, Inc. All rights reserved.
