


Product
Self-service analytics on the fly in Quantum Metric.
By Adam Stewart
Mar 29, 2023

4 min read
As data grows bigger and the stakes for delivering a better customer experience get higher, everyone wants transparency around customer experience KPIs and metrics as well as the ability to improve it, often turning to the data experts for support.
Well, good news: You don’t have to be a data expert to figure it out. The tools to enable your team to self-service analytics quickly and efficiently are available. Here’s how you can help your team help themselves to insights on the fly in Quantum Metric without becoming overwhelmed with too much data.
Visible: Get answers on the spot without leaving your website.
What digital teams love about Quantum Metric is the sheer depth and breadth of insights it offers. But sometimes, you need to be able to provide answers about your data on the spot.
Say you’re in a meeting with leadership, and they start asking questions about website performance. (The pressure’s on!) More specifically, they want to know how people interact with your homepage’s search navigation. While you could point them toward your dashboards and reports, they may lack the time and context to understand what they mean.
Instead, it’d be better to show them something more tangible, like your top-level site data.
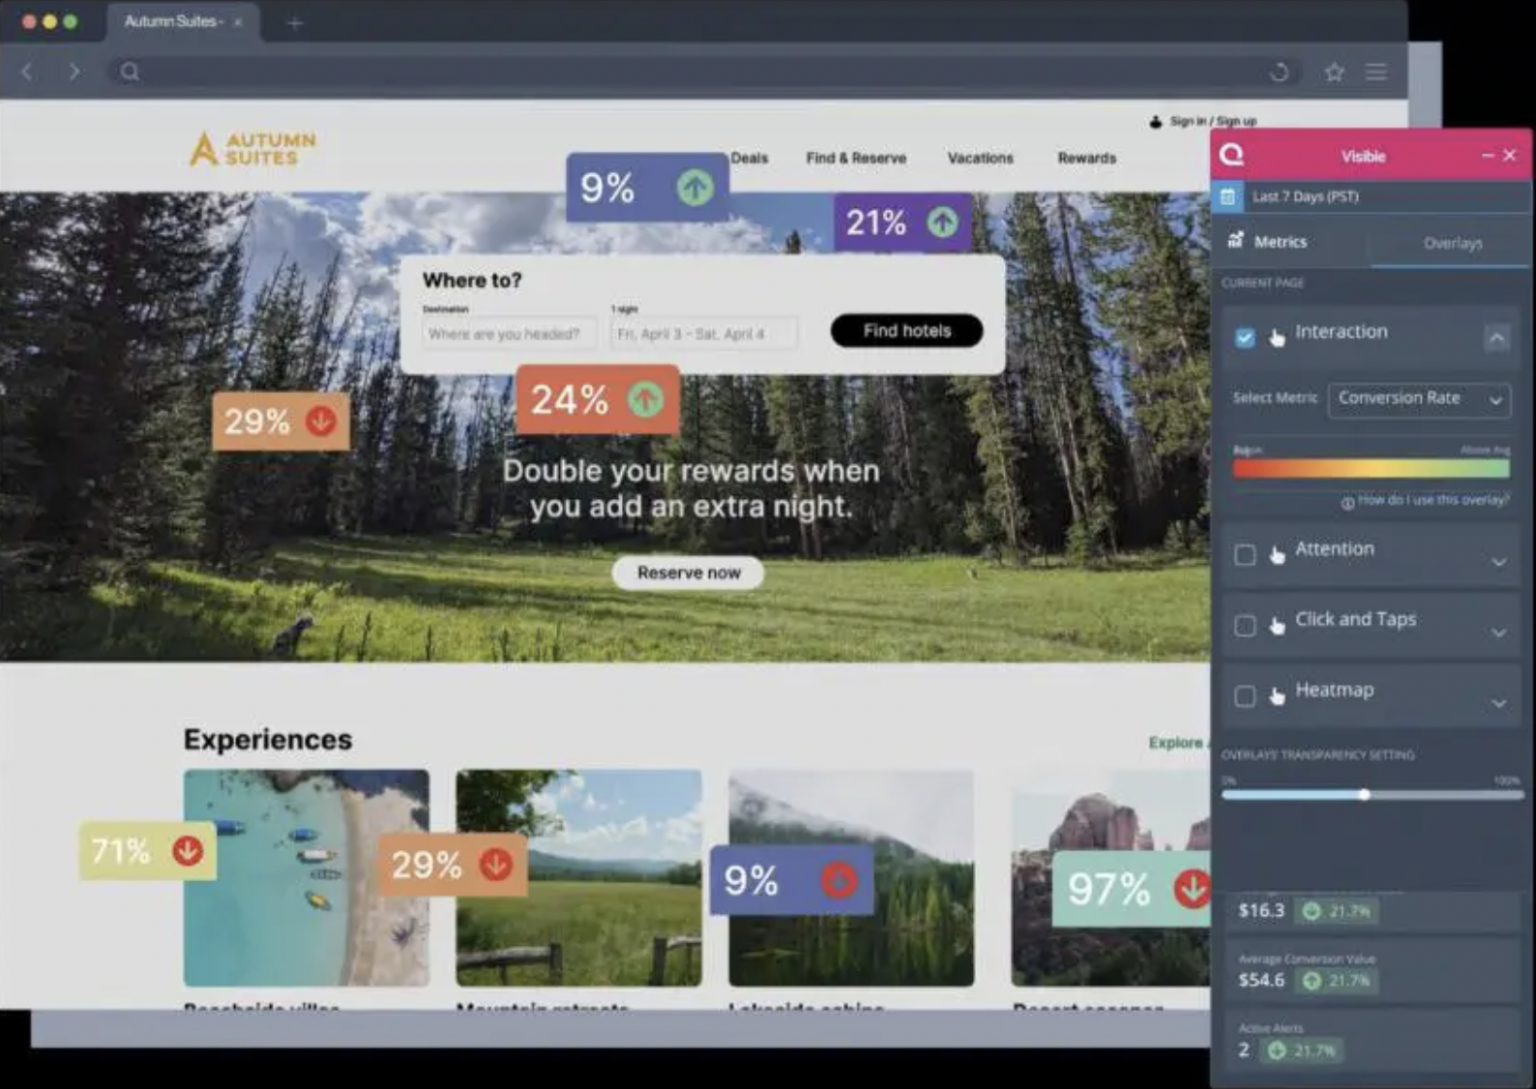
That’s the beauty of Visible: Anyone within your organization can help themselves to data and critical insights, regardless of whether they have a product or technical background. With the Visible plug-in, you can view site-level metrics, heatmaps, and top-engaged elements to get the answers you’re after in seconds, right from your browser, without having to search for them within the Quantum Metric platform.
Dashboards: Analyze and share data faster.
While Visible provides an entry point into the data, what about when you want to deep dive into the data to visualize key data points or answer ad hoc questions on the fly?
Last but not least: dashboards, your go-to for key data and easy access to analyze customer behavior, relay insights, and discover what to do next. For example, you can use dashboards to segment and compare website traffic and visualize KPIs to help you understand how customers convert (i.e., mobile vs. desktop conversions or how a frustration event affects users across different dimensions).
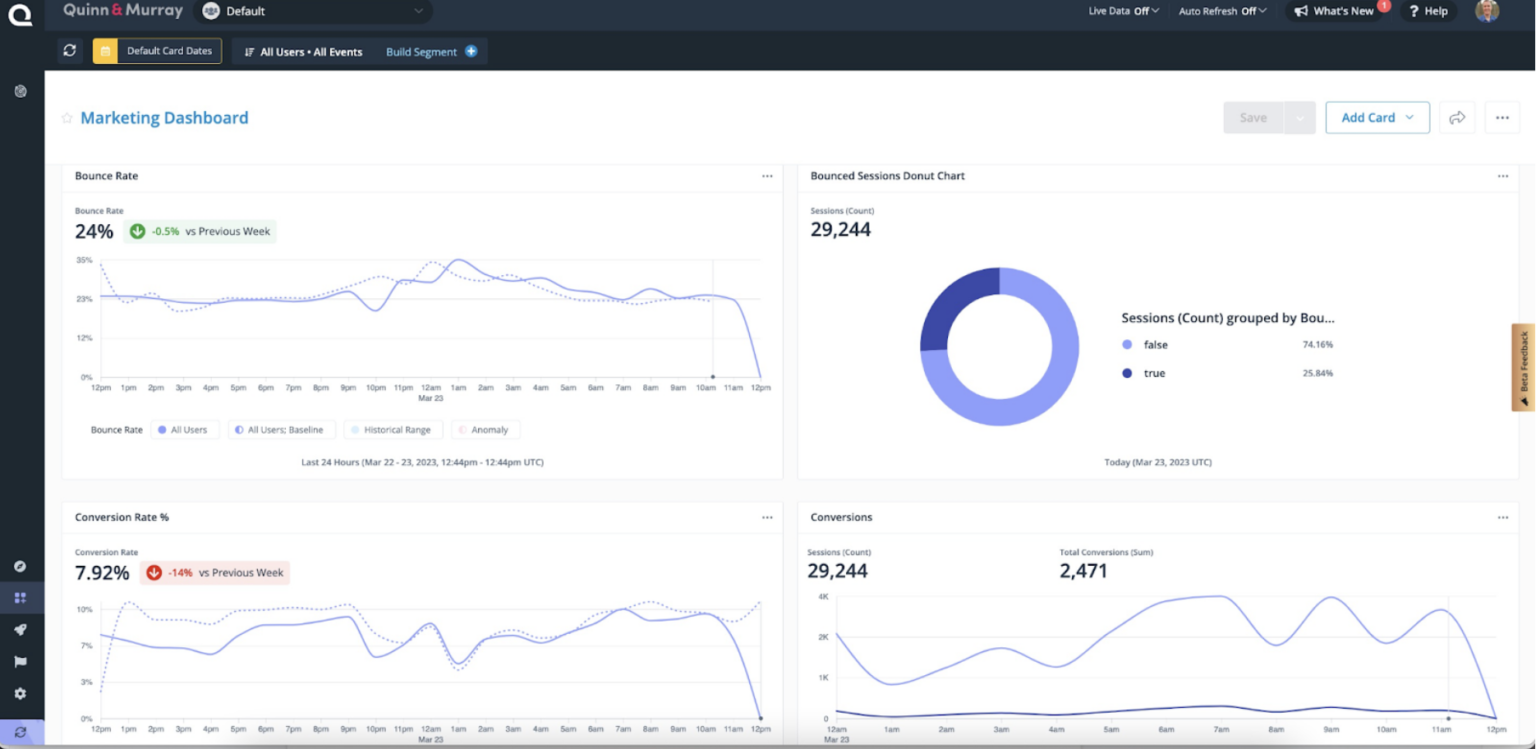

You can also use it during peak times like holidays or product launches by keeping a real-time pulse on what’s happening with the most important metrics. Dashboards can leverage all of the 300+ data points captured by Quantum Metric out-of-the-box.
And dashboards can be private or shared. A private dashboard allows you to refine the data before sharing and keep a sandbox for answering ad hoc questions in a place only you can see. With a shared dashboard, your entire team can benefit from the insights you bring to life in the dashboard, helping others analyze and understand the data points.
Make confident, data-backed decisions on the fly with Quantum Metric.
Self-service is the way forward for many organizations looking to enable confident, data-backed decision-making across teams, regardless of role. Want to learn more about how Quantum Metric can help you make data-backed decisions? Explore Visible and our dashboard templates.

share
Share