Trends & best practices
What is a heatmap and how does it work?
By Quantum Metric
Oct 26, 2023

7 min read
Website heatmaps help businesses visualize complex data from user interactions on their sites or applications in order to improve design, content, and usability. Heatmaps are a valuable source of user data points that can be used by marketers, UX designers, product managers, and analysts to gain data-based insights and develop effective strategies for achieving business objectives.
Below, we discuss what website heatmap tools are, how they work, the different types, why they are used, and what a good heatmap tool provides:
What are website heatmaps?
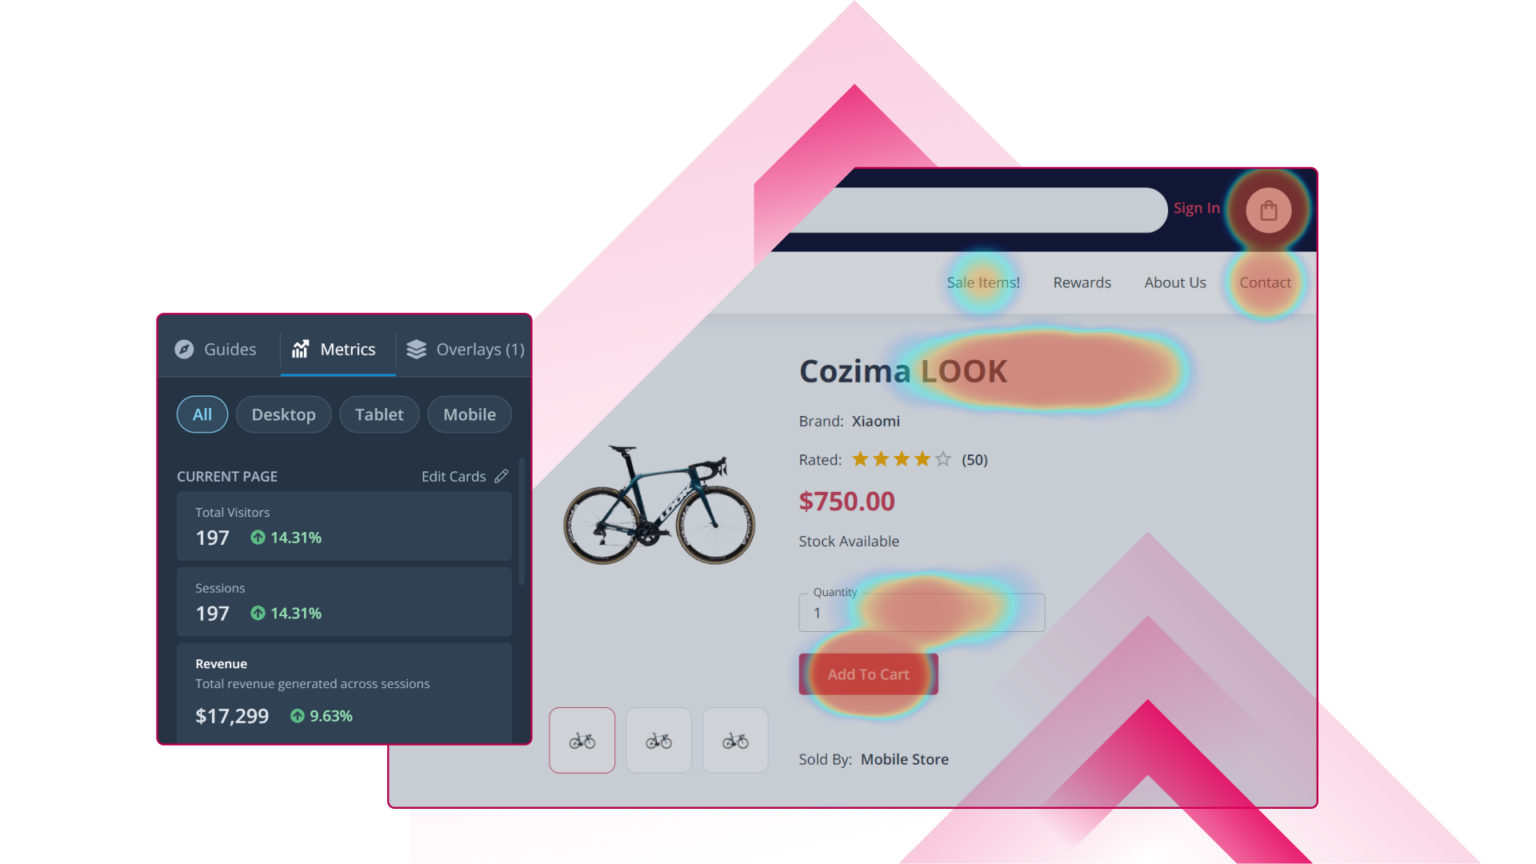
Website heatmaps are powerful web analytics tools that offer a comprehensive understanding of user behavior on a website. These maps utilize color-coded overlays to depict the areas of a webpage that receive the most and least engagement.
By tracking where visitors click, where and how long users scroll, and where they make mouse movements, heatmaps provide a dynamic visual representation of where visitors are most active, enabling businesses to identify hotspots of interest and optimize their website’s design and content layout.
With these actionable insights, organizations can make informed decisions to enhance user experience, boost conversions, and refine their digital strategies, ultimately creating more engaging and effective online platforms.
Types of heatmaps.
A website heatmap comes in a few different forms, each focused on the different ways users interact with your website. Most heatmap software platforms will provide the most essential types of heatmap tools. Here are some basic heatmap types:
Scroll maps.
A scroll map is a type of heatmap that shows what percentage of visitors scroll down a particular webpage.
The entire page is covered by a layer of color gradients that appear warmer or cooler depending on how visitors interact.
Indicators will show how many users scroll down to web page sections. The warmer a particular section, the more popular it was to visitors. Scroll data can help UX designers and marketers determine the optimal place to put their CTA buttons and other important page elements.
Click maps.
A click map is a heatmap type that reveals where users click on a desktop webpage. Certain heatmap software tools can even provide heatmap data from mobile apps, showing where users tap the webpage on their mobile devices.
The warmer the color is on the heatmap, the more website visitors’ behavior tends toward interacting with that element of your webpage.
A click map helps show where individual users engage the most and whether they click on your CTA and additional site buttons. It can also help illuminate potential site navigation issues by showing whether users interact with non-clickable elements, such as too-distracting graphics.
These functions allow your team to work precisely on site elements that will reduce the number of confused and frustrated users.
Hover maps.
Similar to click maps, a hover map — also known as a “move map” — is a type of heatmap that indicates where a number of users hover their mouse cursor on the same page.
The hotter the colored spot is on the heatmap, the longer users visiting the site hover their mouse cursor on that area of the webpage.
This helps visualize user engagement on your site, displays your website’s user journey across different web pages, and can even signal where users are having issues.
Why should you use a web page heatmap tool?
There are many reasons a business should use a website heatmap tool, in particular, it provides visualized data that directly shows visitor behavior on your website. Here are some other vital reasons to use a website heatmap tool:
Track user behavior.
One of the most important functions of a heatmap tool is that it allows businesses to understand user reactions to their website or application’s design, content, and functionality. This provides them with deep insight into how intuitive and accessible their website is and how effective the webpage content is at convincing customers to make a conversion and eventually reach the checkout page.
Other tools, such as Google Analytics, provide plenty of data on whether users react upon reaching a business’s site, but a robust heatmap tool allows them to see why they react a particular way and how they can potentially fix or improve the site further.
Make data-driven decisions.
A good website heatmap tool allows you to utilize every type of heatmap and integrate its insight with other web analytics tool data to form a thorough assessment of how well a website page is performing and what issues it may have. This allows your team to develop potential strategies for further improvement in order to raise conversion rates, all based on precision data analysis provided by your heatmap tool.
Test new features or website pages.
Finally, heatmap tools also give product managers and UX designers the ability to effectively test potential features on a mobile app or a new webpage on their company’s website. For example, when used in A/B testing experiments, a product team can determine whether dynamic elements added to an updated webpage helps convert more visitors compared to a control version.
With heatmapping, the team can use hover or scroll heatmaps to determine if the dynamic elements engaged users enough to make conversions.
Heatmaps are an incredible data analytics tool every business should incorporate into its digital analytics toolbox.
Improve your website with heatmaps and other analytics tools from Quantum Metric.

While most heatmap tools help define users’ behavior on your website, Quantum Metric ties its heatmapping to its web analytics tools to ensure you receive deeper, more accessible insights for faster and easier decision making. With Quantum Metric, your teams will have all the necessary quantitative and qualitative data at their fingertips, ensuring every aspect of your product or website responds precisely to user feedback.
If you want to discover how Quantum Metric’s heatmap and data analytics features can help your business, contact us or schedule a demo today.


share
Share